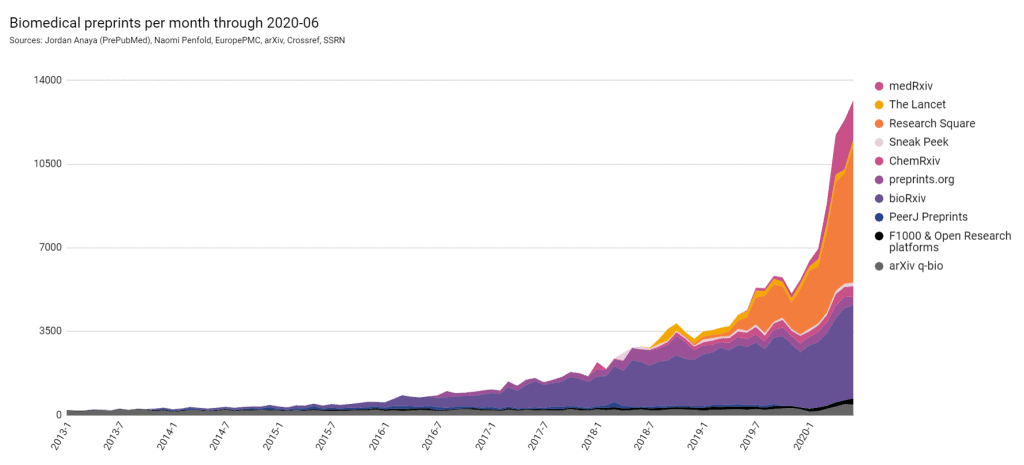
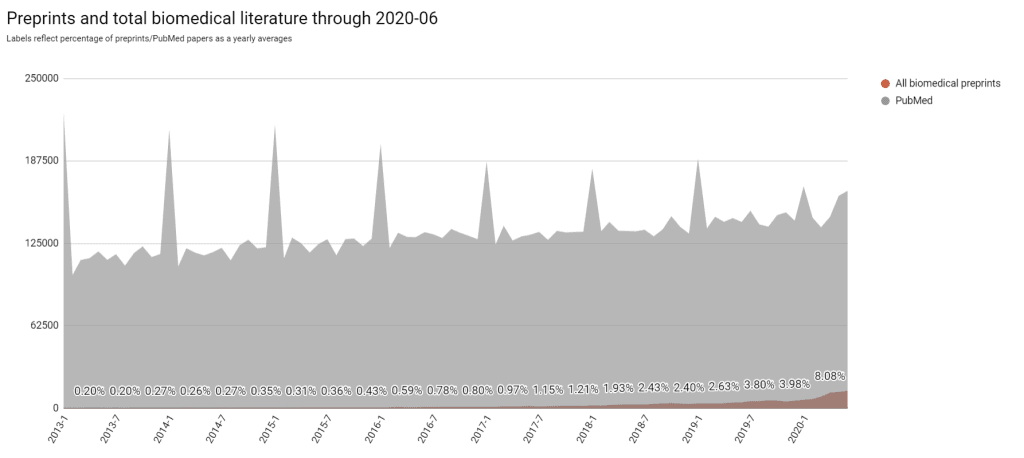
While the practice of preprinting in the life sciences is not completely new, it has grown dramatically over the past few years.

Note: this does not yet include 6,000 preprints on relevant OSF platforms. See Zenodo record for more details and raw data.
However, preprints still represent a small fraction of the overall biomedical literature.

Our previous calculations of preprints as a fraction of the biomedical literature are here.
Older sources
PrePubMed
Until December 2018, Jordan Anaya, the creator of the preprint search engine, PrePubMed, released monthly statistics for preprints indexed by his tool. In addition to the aggregate chart shown below (for June 2018), Jordan also presented new senior authors added per month and a real-time analytics tool that creates graphs for preprints posted in any subject area of a search term of your choice. Try it now.
European Commission visualization
Containing data through 2015, te European Commission’s Open Science Monitor features a beautiful visualization of the temporal and geographical distribution of preprints in different fields. While this tool includes fewer sources than PrePubMed, it highlights the inchoate nature of preprints in the life sciences compared to other subjects. To view the tool, click the link under “Preprints” here. (via John Inglis)
